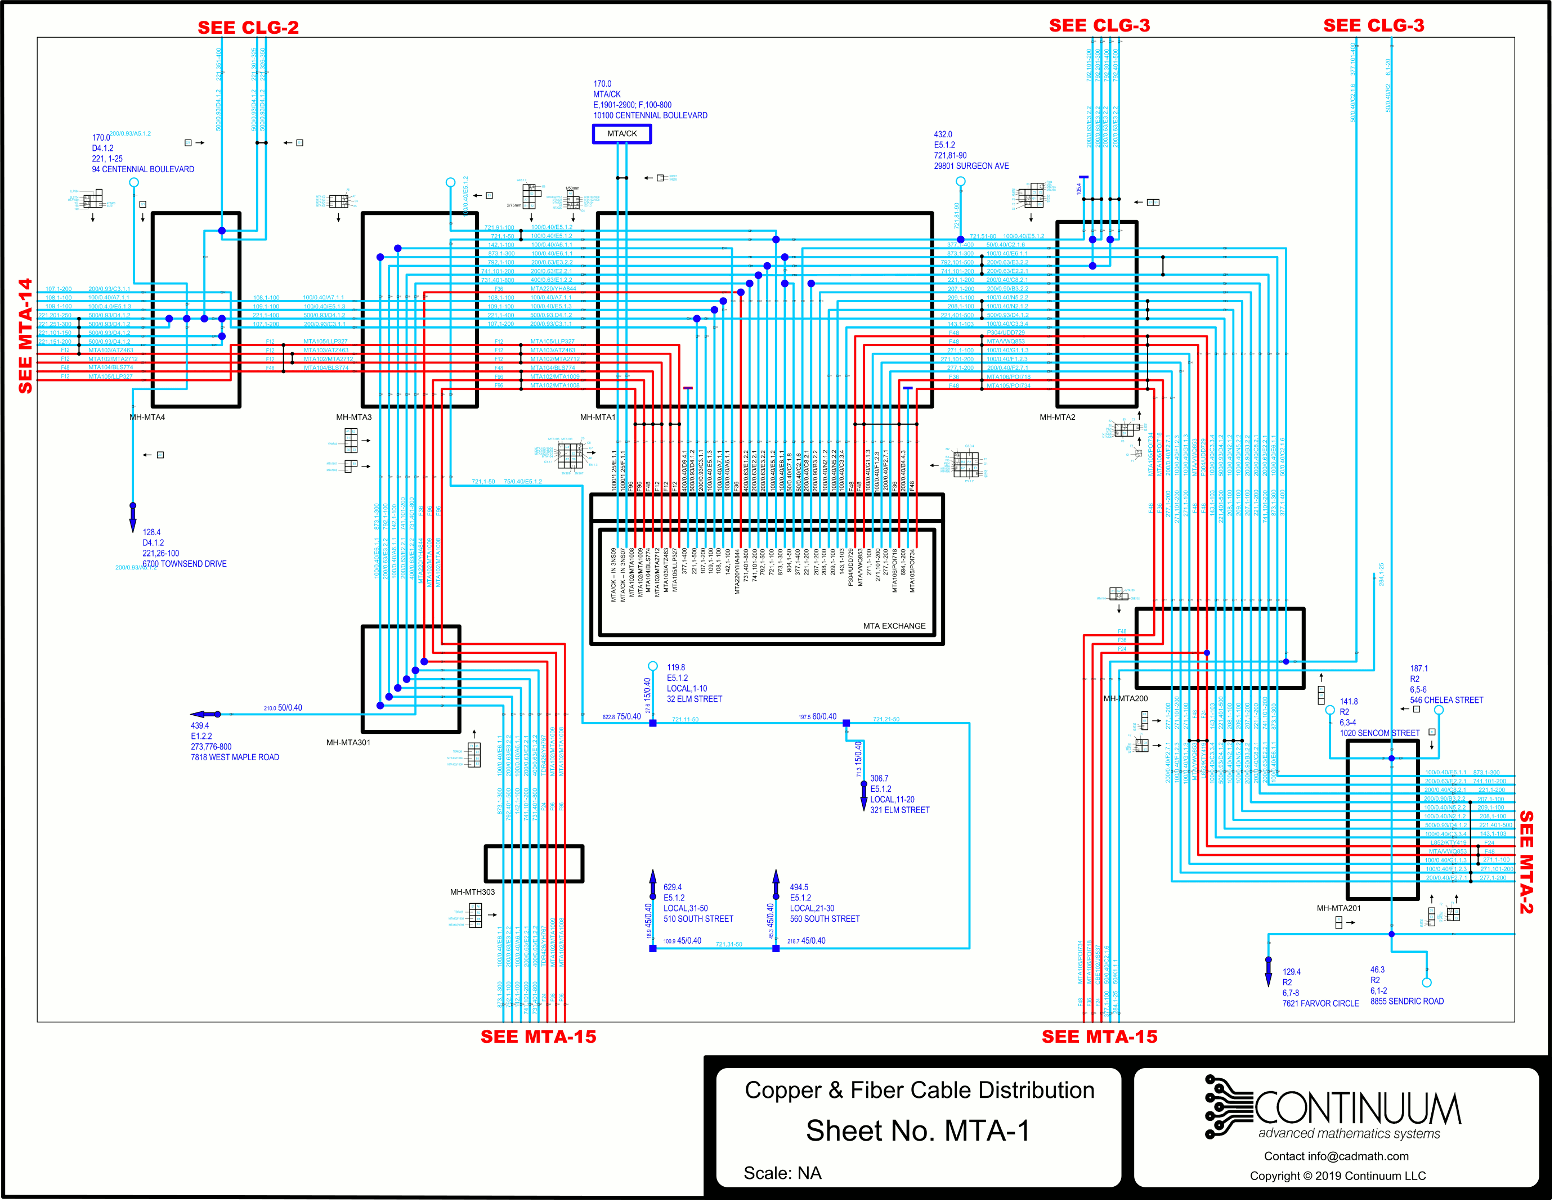


Telecom Outside Plant – a "geo-schematic" preserving alignments of manholes and cables. Red lines are optical fiber, blue lines copper cable.
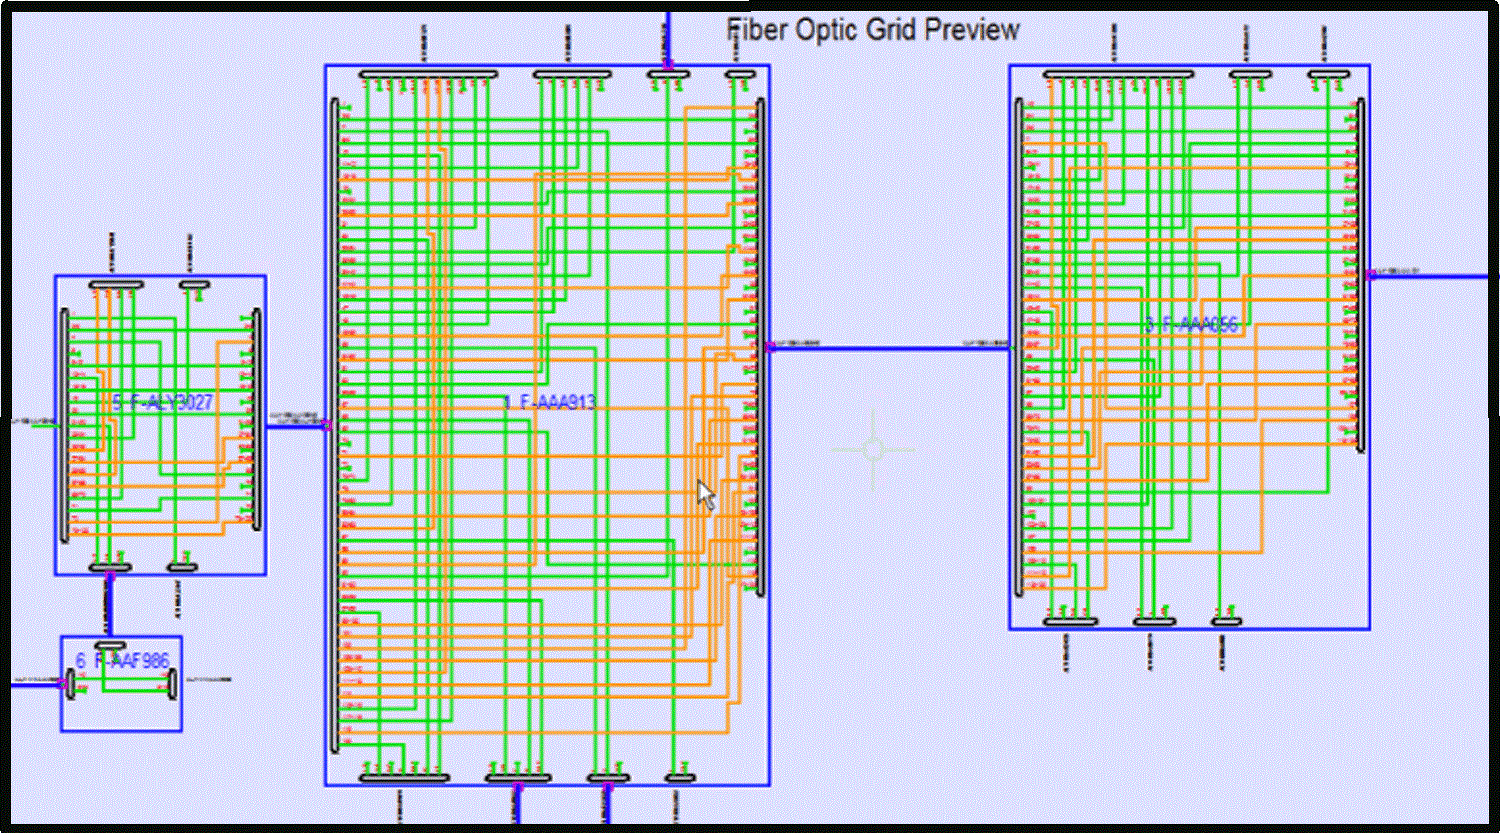
Telecom companies often use several types of diagrams. Designers and business managers find fiber Grid Diagrams essential for tracing and planning where to add connections, while outside plant contractors use Distribution Diagrams to see the layout of manholes and configuration of conduits when they excavate or install cable. Adding new customers is much easier when a schematic quickly shows the best path to the POC, Primary Node or Central Office.

A large telecom customer required Geoschematics produce both types of diagrams: pure schematic Fiber Grid Diagram showing individual fibers running through and between manholes, and semi-schematic Distribution Diagram showing copper and fiber cables with conduit configuration. Geoschematics software produced the diagrams automatically from the same GIS data.

Copyright © 2017-2020 CONTINUUM LLC All Rights Reserved