

This Geoschematics drawing remains easy to read despite containing more than 2000 fibers and 500 splices.
Splice Diagrams or Matrices capture an electric or optical network inside a location – documenting cables, ported equipment, and connections. Splices are fiber-to-fiber, port-to-fiber and port-to-port. The location may be any splice container, such as a manhole, a piece of rack mounted equipment, or a room full of equipment.
This case study walks through a variety of Geoschematics splice diagram uses and the corresponding drafting formats. Examples show how Geoschematics can map data from the same network to multiple views utilizing corresponding formats. Complementary views of the same data is a powerful aid to working with the network.
Cables and splice closures fill an underground utility box. Technicians depend on splice matrices to make sense of the contents.

An optical cable containing 12 fibers. In this cable, the fibers are grouped in a blue bundle and an orange bundle.
In the simplest splice matrices, each splice is represented by a distinct polyline drawn between two points.
The simple splice diagram displays a point for each individual fiber, and a polyline for every splice. The simple splice diagram works for drawings containing up to about 300 fibers or 100 splices, but for more complex drawings, readability becomes a problem. All drafting systems, except Geoschematics, are limited to the simple splice diagram. Technicians are forced to make do with diagrams that omit most fibers at a location.
Geoschematics surpasses the simple splice diagram and handles more complicated drawings, without sacrificing information or readability.
A simple splice diagram with 132 fibers and 66 splices. The first drawing, with 2,160 fibers and 562 splices, uses a more efficient format and is easier to read.

Geoschematics uses proprietary fiber bubbles to considate splice polylines. Splice line overplotting is reduced dramatically. For the first time, large, complex matrices can be displayed in full.
Splice diagram containing four fiber bubbles. The remaining 4 fibers are not spliced in order, so they are not grouped in bubbles.
This example shows a simple but elegant splice diagram containing four fiber bubbles. Each bubble is connected to a bubble on the opposite cable. The four remaining fibers are spliced in an unusual crossing pattern.
Fiber bubbles consolidate splices.
A fiber bubble is a group of consecutive fibers. A line between two fiber bubbles indicates that each fiber in the first bubble is spliced to the corresponding fiber in the second bubble.
Examples of Abbreviated Sheath Annotations. 96 spliced fibers on left, 36 unconnected fibers on right
An Abbreviated Sheath Annotation is used to represent two runs of fibers spliced in pairs, or a run of unspliced fibers.
A splice diagram containing 206 splices and 474 fibers, more than 3 times the simple splice diagram example. Splice bubbles and abbreviated sheath annos conserve whitespace. The drawing is compact and easy to read.
Another Geoschematics option is to draw splice matrices inside a spreadsheet, such as Microsoft Excel. Each row represents either one unconnected fiber, or a fiber and its connected partner. The common fibers in each cable occupy the same column. Columns that don't represent cables record fiber properties, such as ring number and the source of the optical path leading the fiber. The number of fiber properties that can be recorded is only limited by spreadsheet's width, so 10 or more properties can easily be supported. The Spreadsheet will grow to lengthy and it is more difficult than point and line diagrams to see overall splice patterns. For this reason, companies often use both a spreasheet and point and polyline diagrams.
Splice Diagram as an Excel spreadsheet.
This example shows initial rows of an Excel splice diagram. Only the first 59 fibers of the first cable, and the fibers spliced to them, appear in the visible portion. Remaining fibers are below the portion of the spreadsheet that is shown.
A Fiber Grid displays a network of cables and splice containers. Workers use it to trace fiber paths through multiple containers. Within each of the containers, cables are divided into line-of-count units capturing consecutive sequences of fibers. Either all fibers in a line-of-count are spliced to corresponding fibers in another line-of-count, or all are terminated.
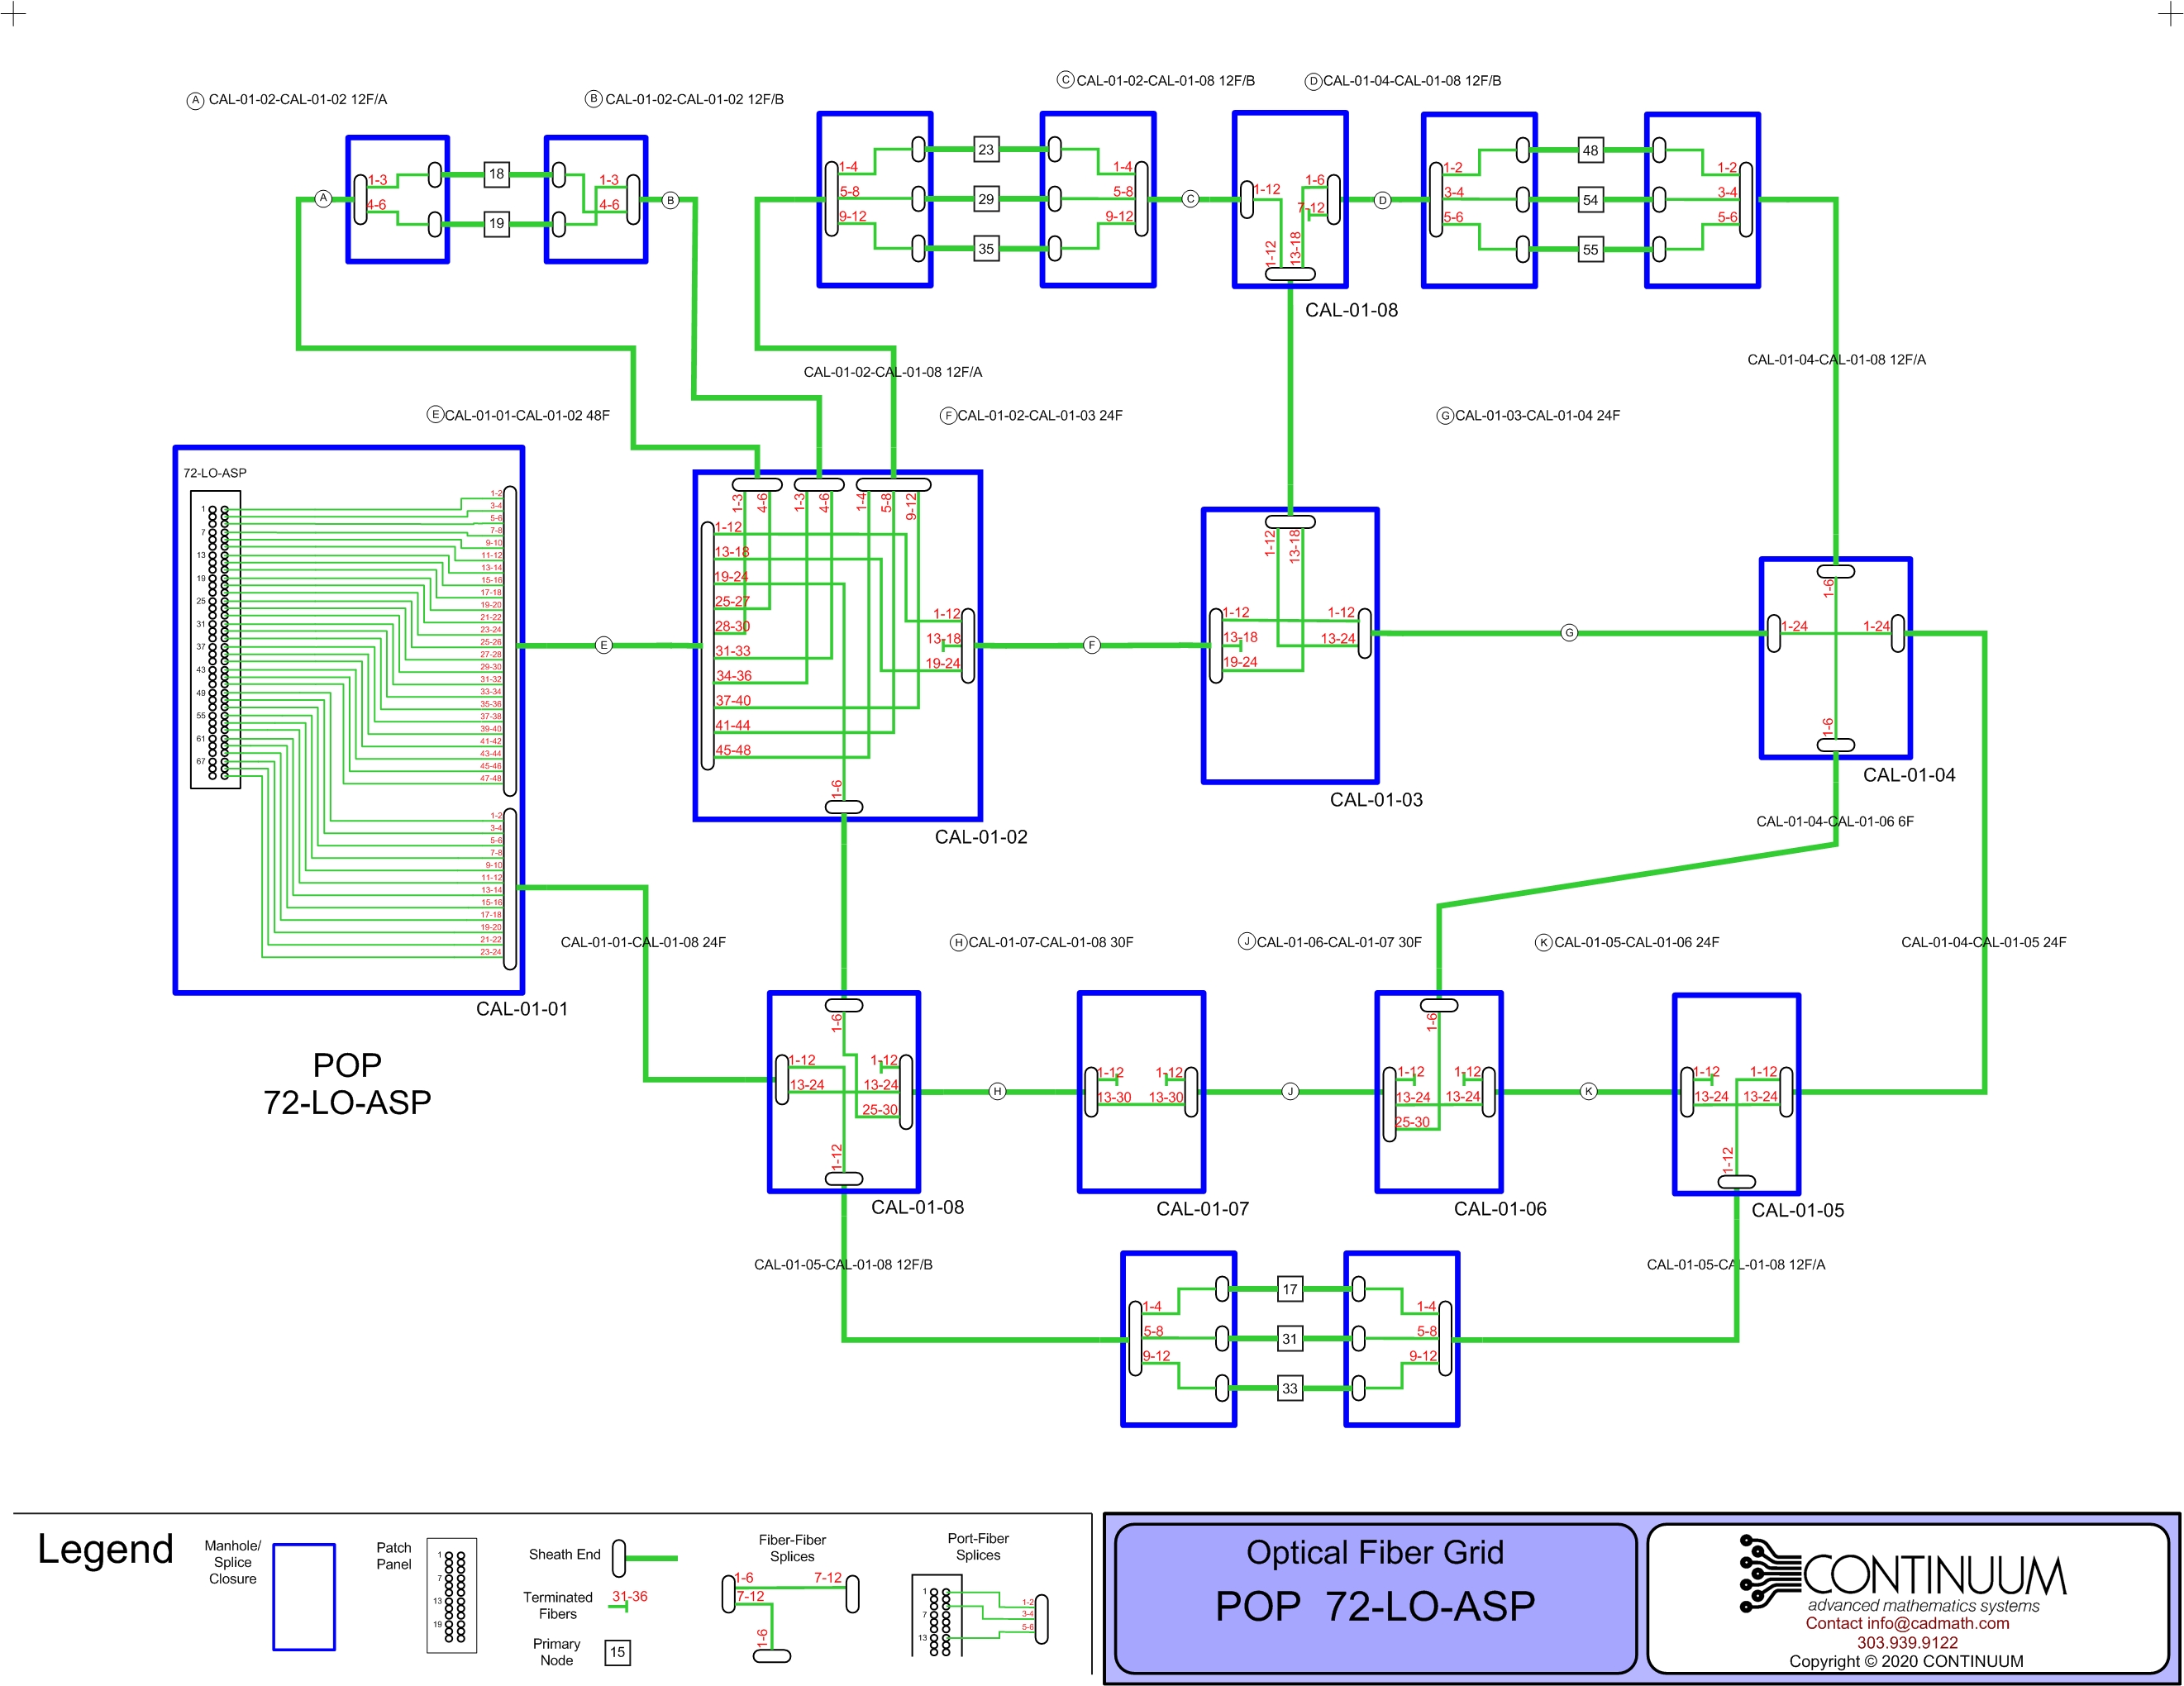
A Fiber Grid showing a POP, downstream splice containers, and delivery nodes.
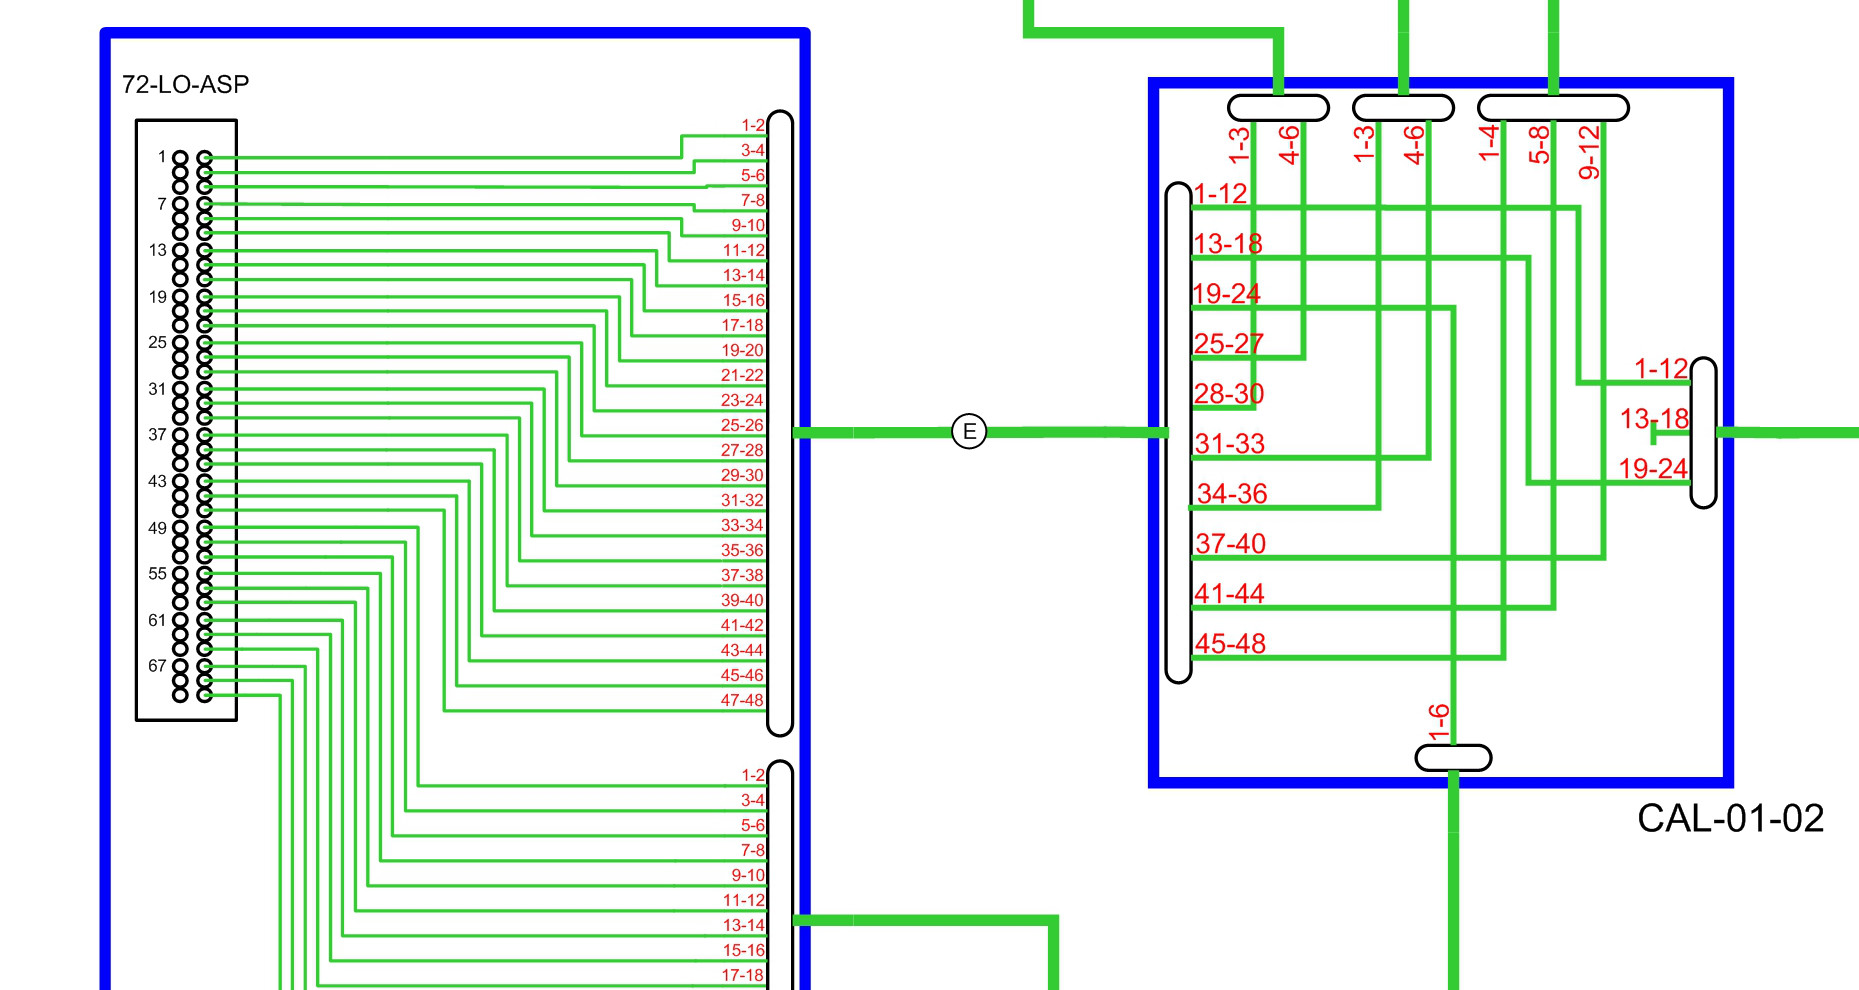
Detail from the previous diagram. A site containing a patch panel is represented on the left and a manhole on the right.
In this network, fiber paths begin at ports in a patch panel, shown on the left side of the drawing. The drawing uses line-of-count splice representations.
Copyright © 2017-2020 CONTINUUM LLC All Rights Reserved